Troubleshooting with Konnect Debugger

Konnect Debugger provides a connected debugging experience and real-time trace-level visibility into API traffic, enabling you to:

  • Troubleshoot issues: Investigate and resolve problems during deployments or incidents with targeted, on-demand traces.
  • Understand request lifecycle: Visualize exactly what happened during a specific request, including order and duration plugin execution. See Debugger spans for a list of spans captured.
  • Improve performance and reliability: Use deep insights to fine-tune configurations and resolve bottlenecks.
  • Find CPU-intensive functions: Use CPU profiling to see which functions or custom plugins consume the most CPU time.

Kong Konnect’s Debugger provides exclusive, in-depth insights not available through third-party telemetry tools. The detailed traces captured during a live session are unique to Kong and offer unparalleled visibility into system behavior.

Best practices

Debugger works best for investigating specific issues, and is not recommended for continuous monitoring. Use it for investigating problems like:

  • API errors
  • Authentication failures
  • Plugin execution problems
  • Unexpected routing behavior
  • Performance degradation
  • Upstream connectivity issues

To get the most out of a session, we recommend keeping the following practices in mind:

  • Start with a clear objective. A session without a specific question to answer generates unnecessary telemetry and makes root-cause analysis harder.
  • Use the smallest scope possible. Before you start, narrow the session to a specific Route, Service, Consumer, or request attribute. Scope to an entire control plane only when you need to, and use advanced sampling rules.

Capture traces and logs

Konnect Debugger allows you to capture traces and logs.

Traces

Traces provide a visual representation of the request and response lifecycle, offering a comprehensive overview of Kong’s request processing pipeline.

The debugger helps capture OpenTelemetry-compatible traces for all requests matching the sampling criteria. The detailed spans are captured for the entire request/response lifecycle. These traces can be visualized with Konnect’s built-in span viewer with no additional instrumentation or telemetry tools. For a complete list of available spans and their meanings, see Debugger spans.

Key Highlights

  • Traces can be generated for a service or per route
  • Refined traces can be generated for all requests matching a sampling criteria
  • Sampling criteria can be defined with simple expressions language, for example: http.method == GET
  • Trace sessions are retained for up to 15 days
  • Traces and CPU profiles can be pinned for longer retention
  • Traces can be visualized in Konnect’s built in trace viewer

To ensure consistency and interoperability, tracing adheres to OpenTelemetry naming conventions for spans and attributes, wherever possible.

Logs

For deeper insights, logs can be captured along with traces. When initiating a debug session, administrators can choose to capture logs. Detailed Kong Gateway logs are captured for the duration of the session. These logs are then correlated with traces using trace_id and span_id providing a comprehensive and drill-down view of logs generated during specific trace or span.

Reading traces and logs

Traces captured during a debug session can be visualized in debugger’s built-in trace viewer. The trace viewer displays Summary, Spans and Logs view. You can gain instant insights with the summary view while the spans and logs view help you to dive deeper. You can also download captured traces.

All Konnect users can upload a trace .json or .zip file (for example, one downloaded from a debug session) to view by navigating to Observability > Debugger and clicking Upload trace. This lets users view traces even if they don’t have permission to create or start debug sessions.

Summary view

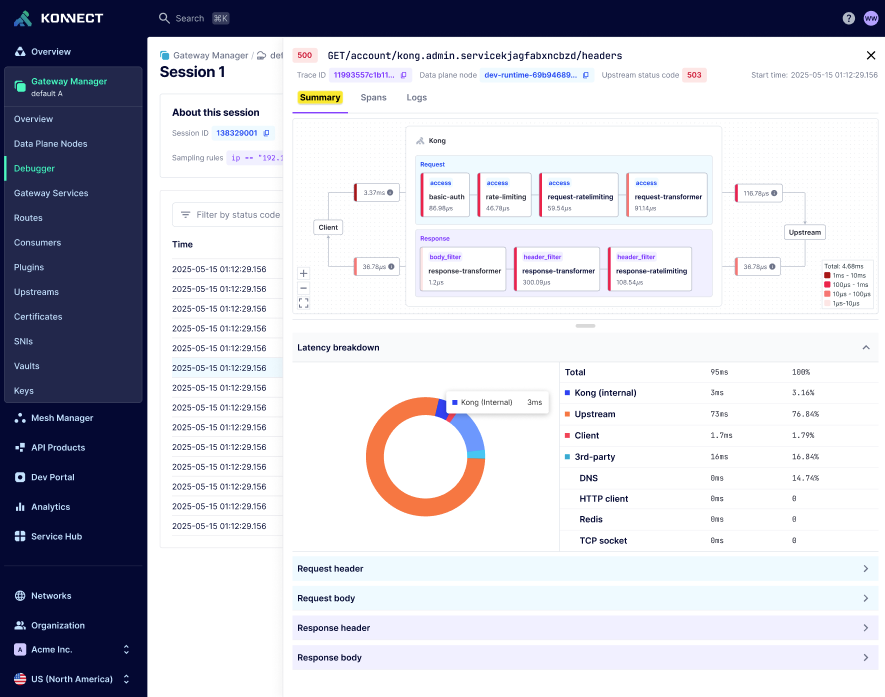
Summary view helps you visualize the entire API request-response flow in a single glance. This view provides a concise overview of critical latency metrics and a transaction map. The lifecycle map includes the different phases of Kong Gateway and the plugins executed by Kong Gateway on both the request and the response along with the times spent in each phase.

Use the summary view to quickly understand the end-to-end API flow, identify performance bottlenecks, and optimize your API strategy: Debugger Summary view

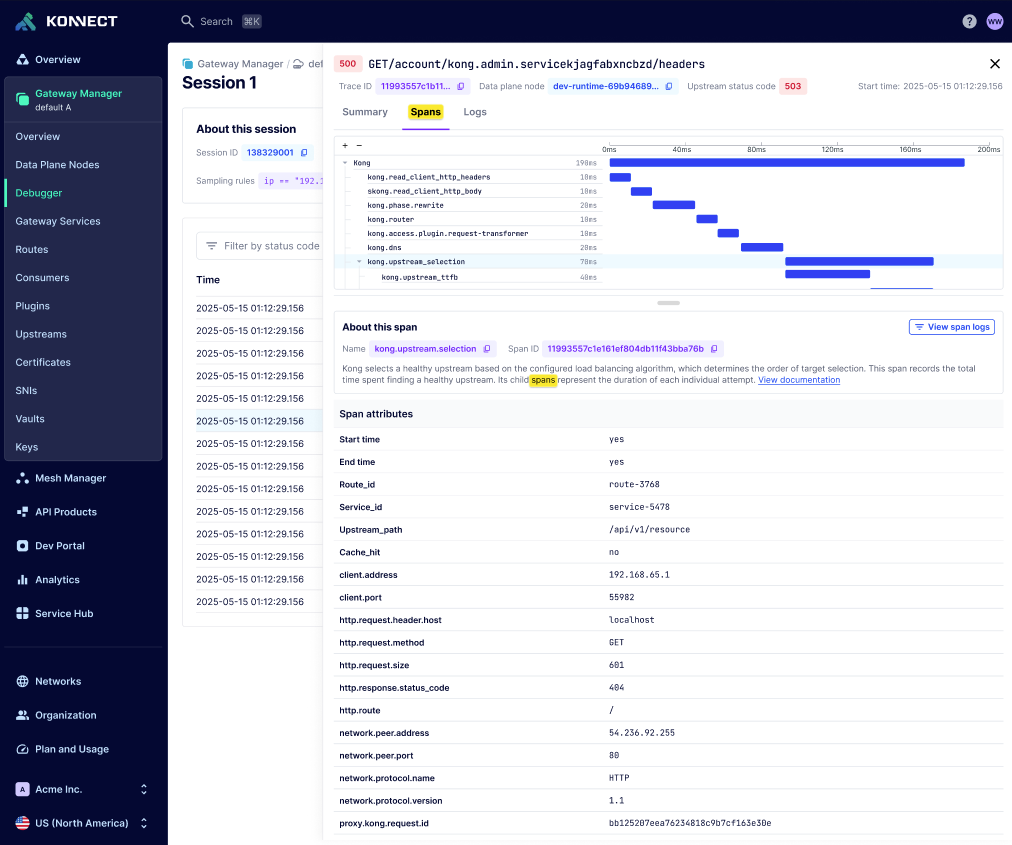
Spans view

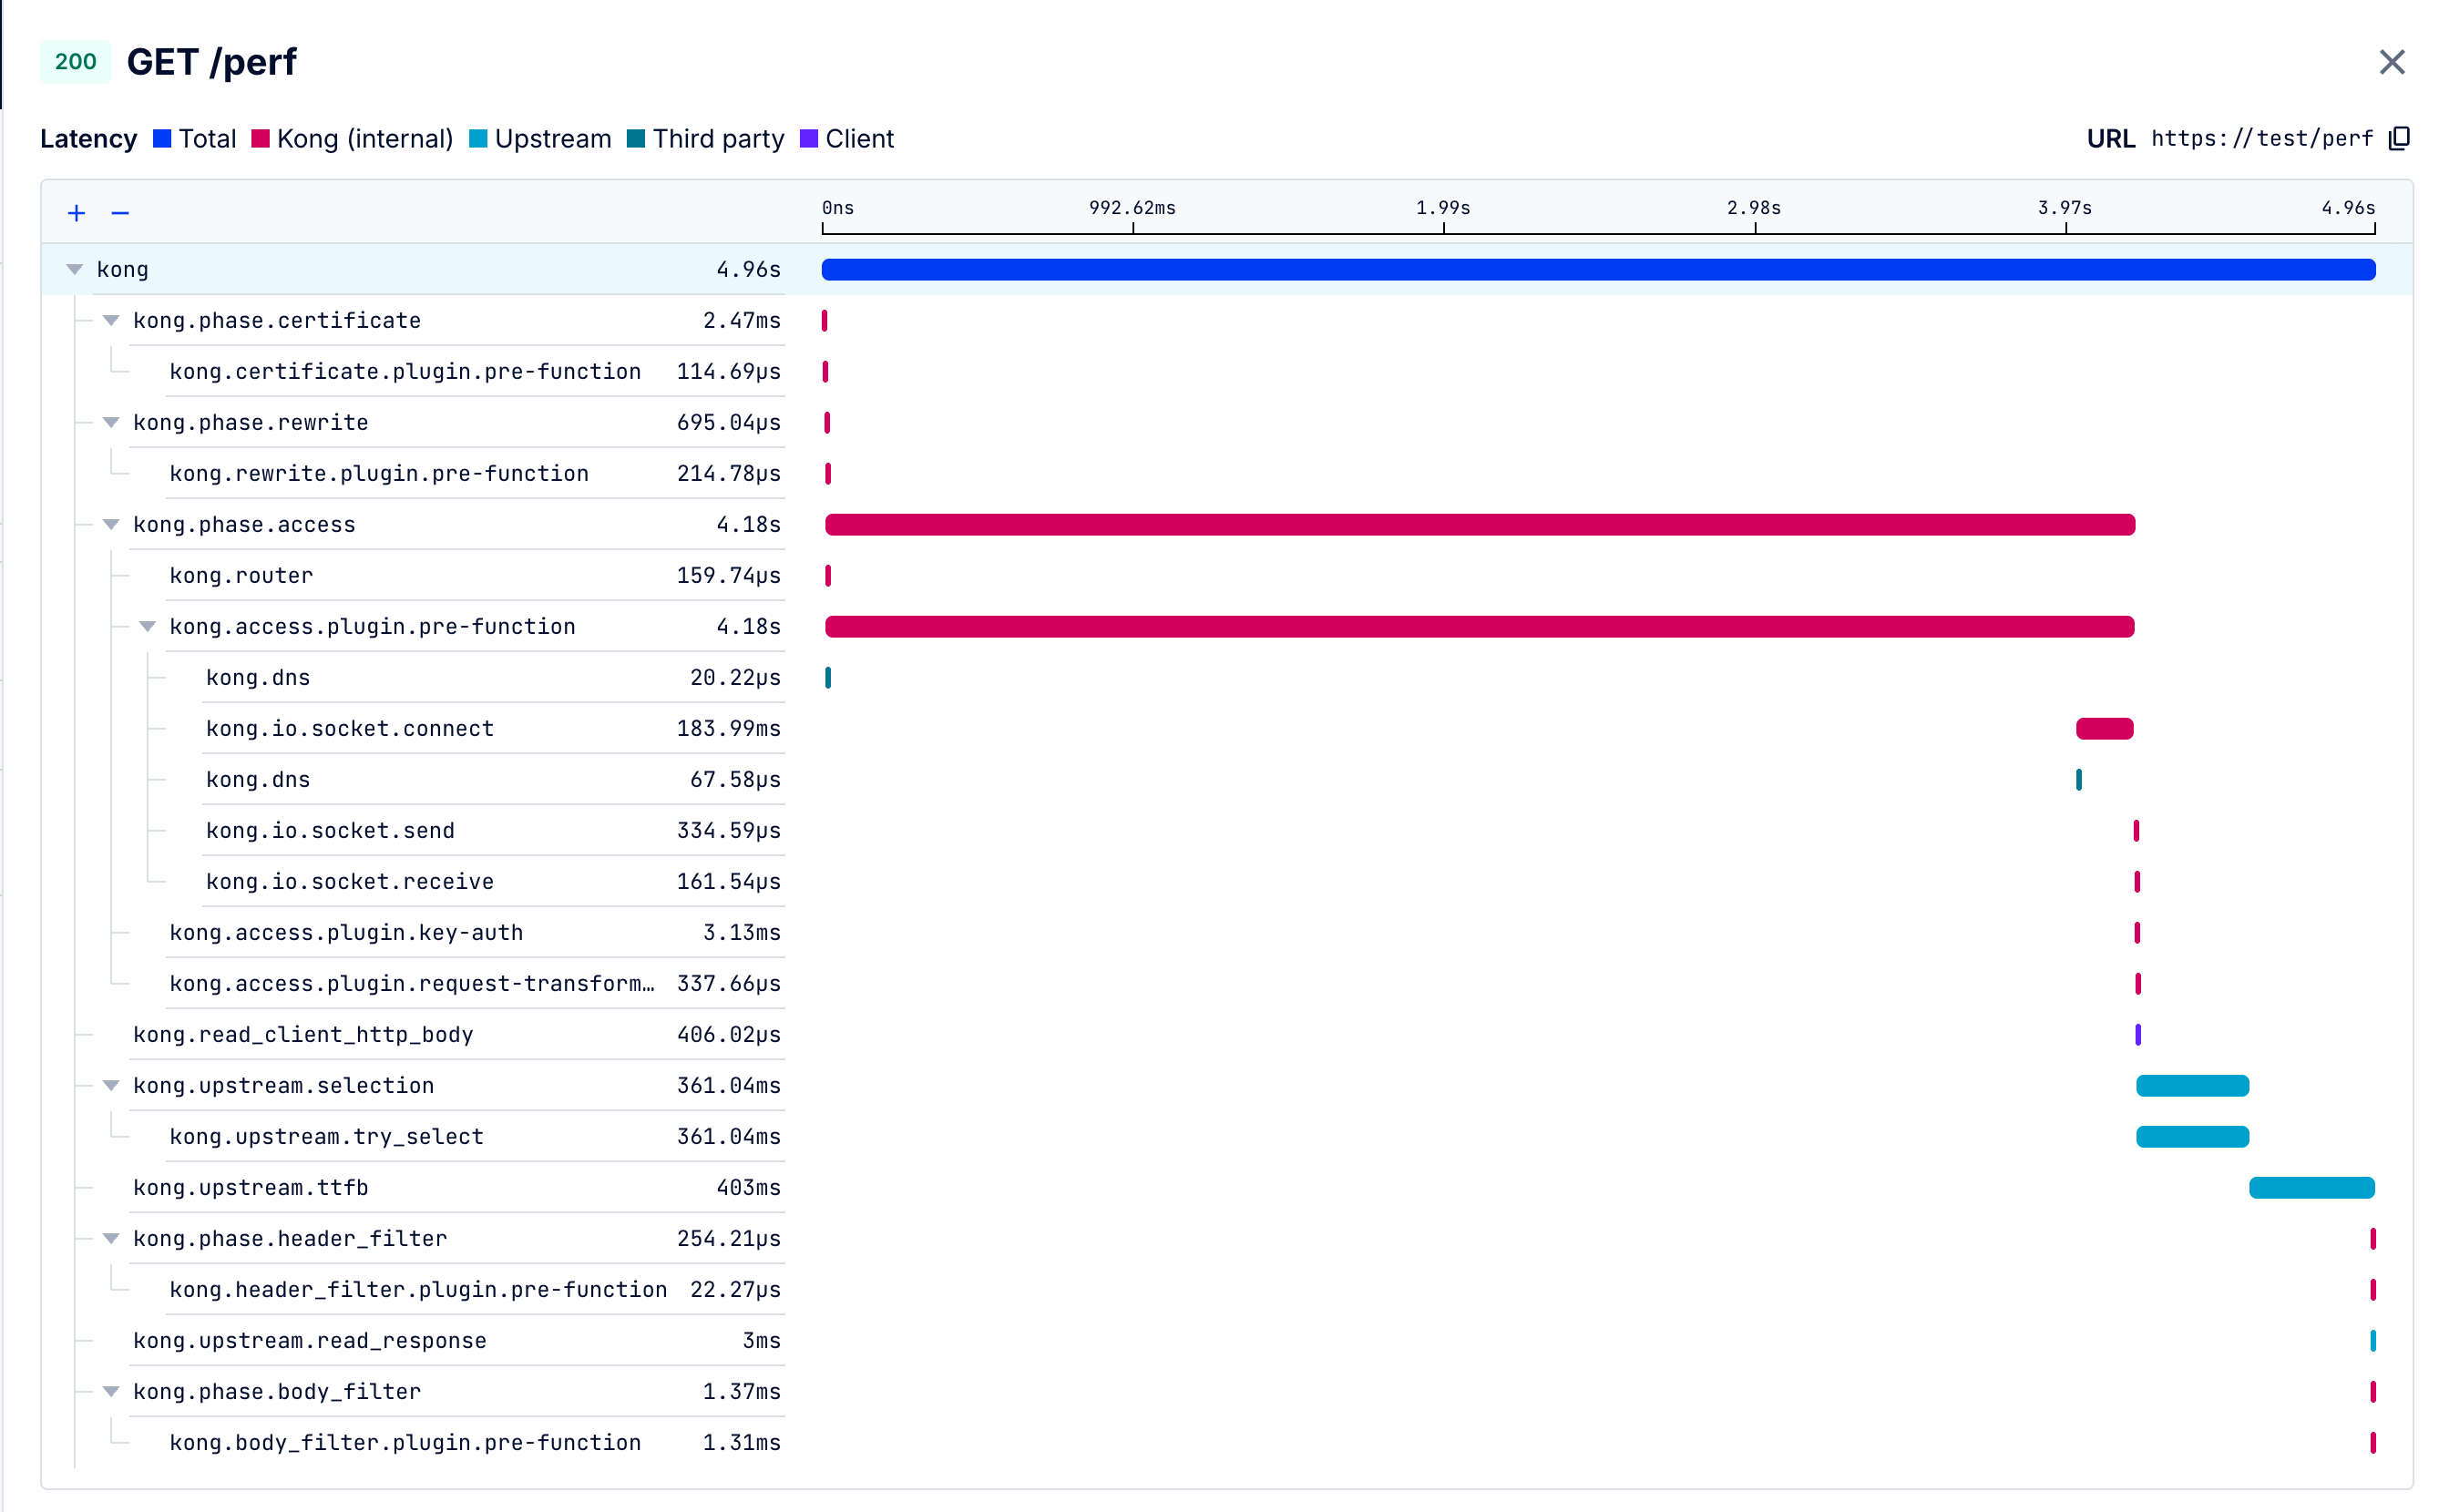
The spans view gives you unparalleled visibility into Kong Gateway’s internal workings. This detailed view breaks down into individual spans, providing a comprehensive understanding of:

  • Kong Gateway’s internal processes and phases
  • Plugin execution and performance
  • Request and response handling

For detailed definitions of each span, see Debugger spans.

Use the spans view to troubleshoot issues, optimize performance, and refine your configuration: Debugger Spans view

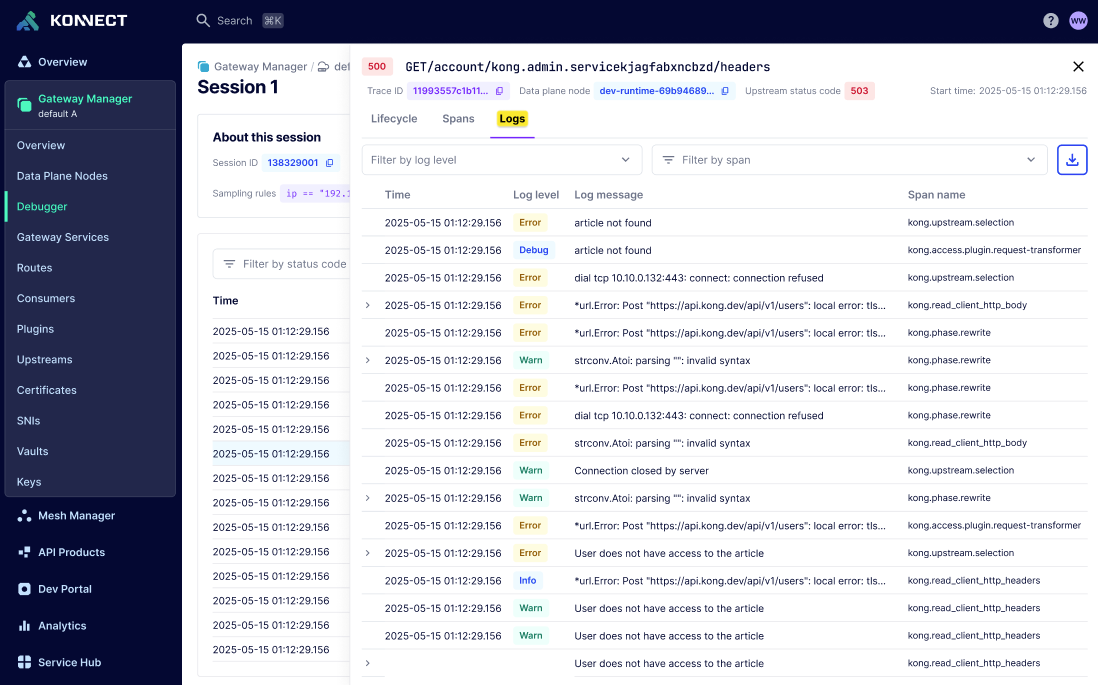
Logs view

The logs view gives you a drill-down view of all the logs generated during specific debug session. All the spans in the trace are correlated using trace_id and span_id. The logs can be filtered on log level and spans. Logs are displayed in reverse chronological order. Konnect encrypts all the logs that are ingested. You can further ensure complete privacy and control by using customer-managed encryption keys (CMEK).

Use the logs view to quickly troubleshoot and pinpoint issues: Debugger Logs view

Analyze with KAi

When viewing a trace, you can click Analyze with KAi to send the trace to KAi. The trace summary, spans, and logs are automatically applied as context. KAi can help identify errors, determine their probable root cause, and answer questions about the request, such as:

  • Why is my API returning 5xx errors?
  • Why is the OIDC plugin execution failing?
  • Why is the /flights API slow?
  • What is the plugin execution order for this route?
  • Why does my hybrid gateway have connectivity issues with the upstream?

Profile CPU usage

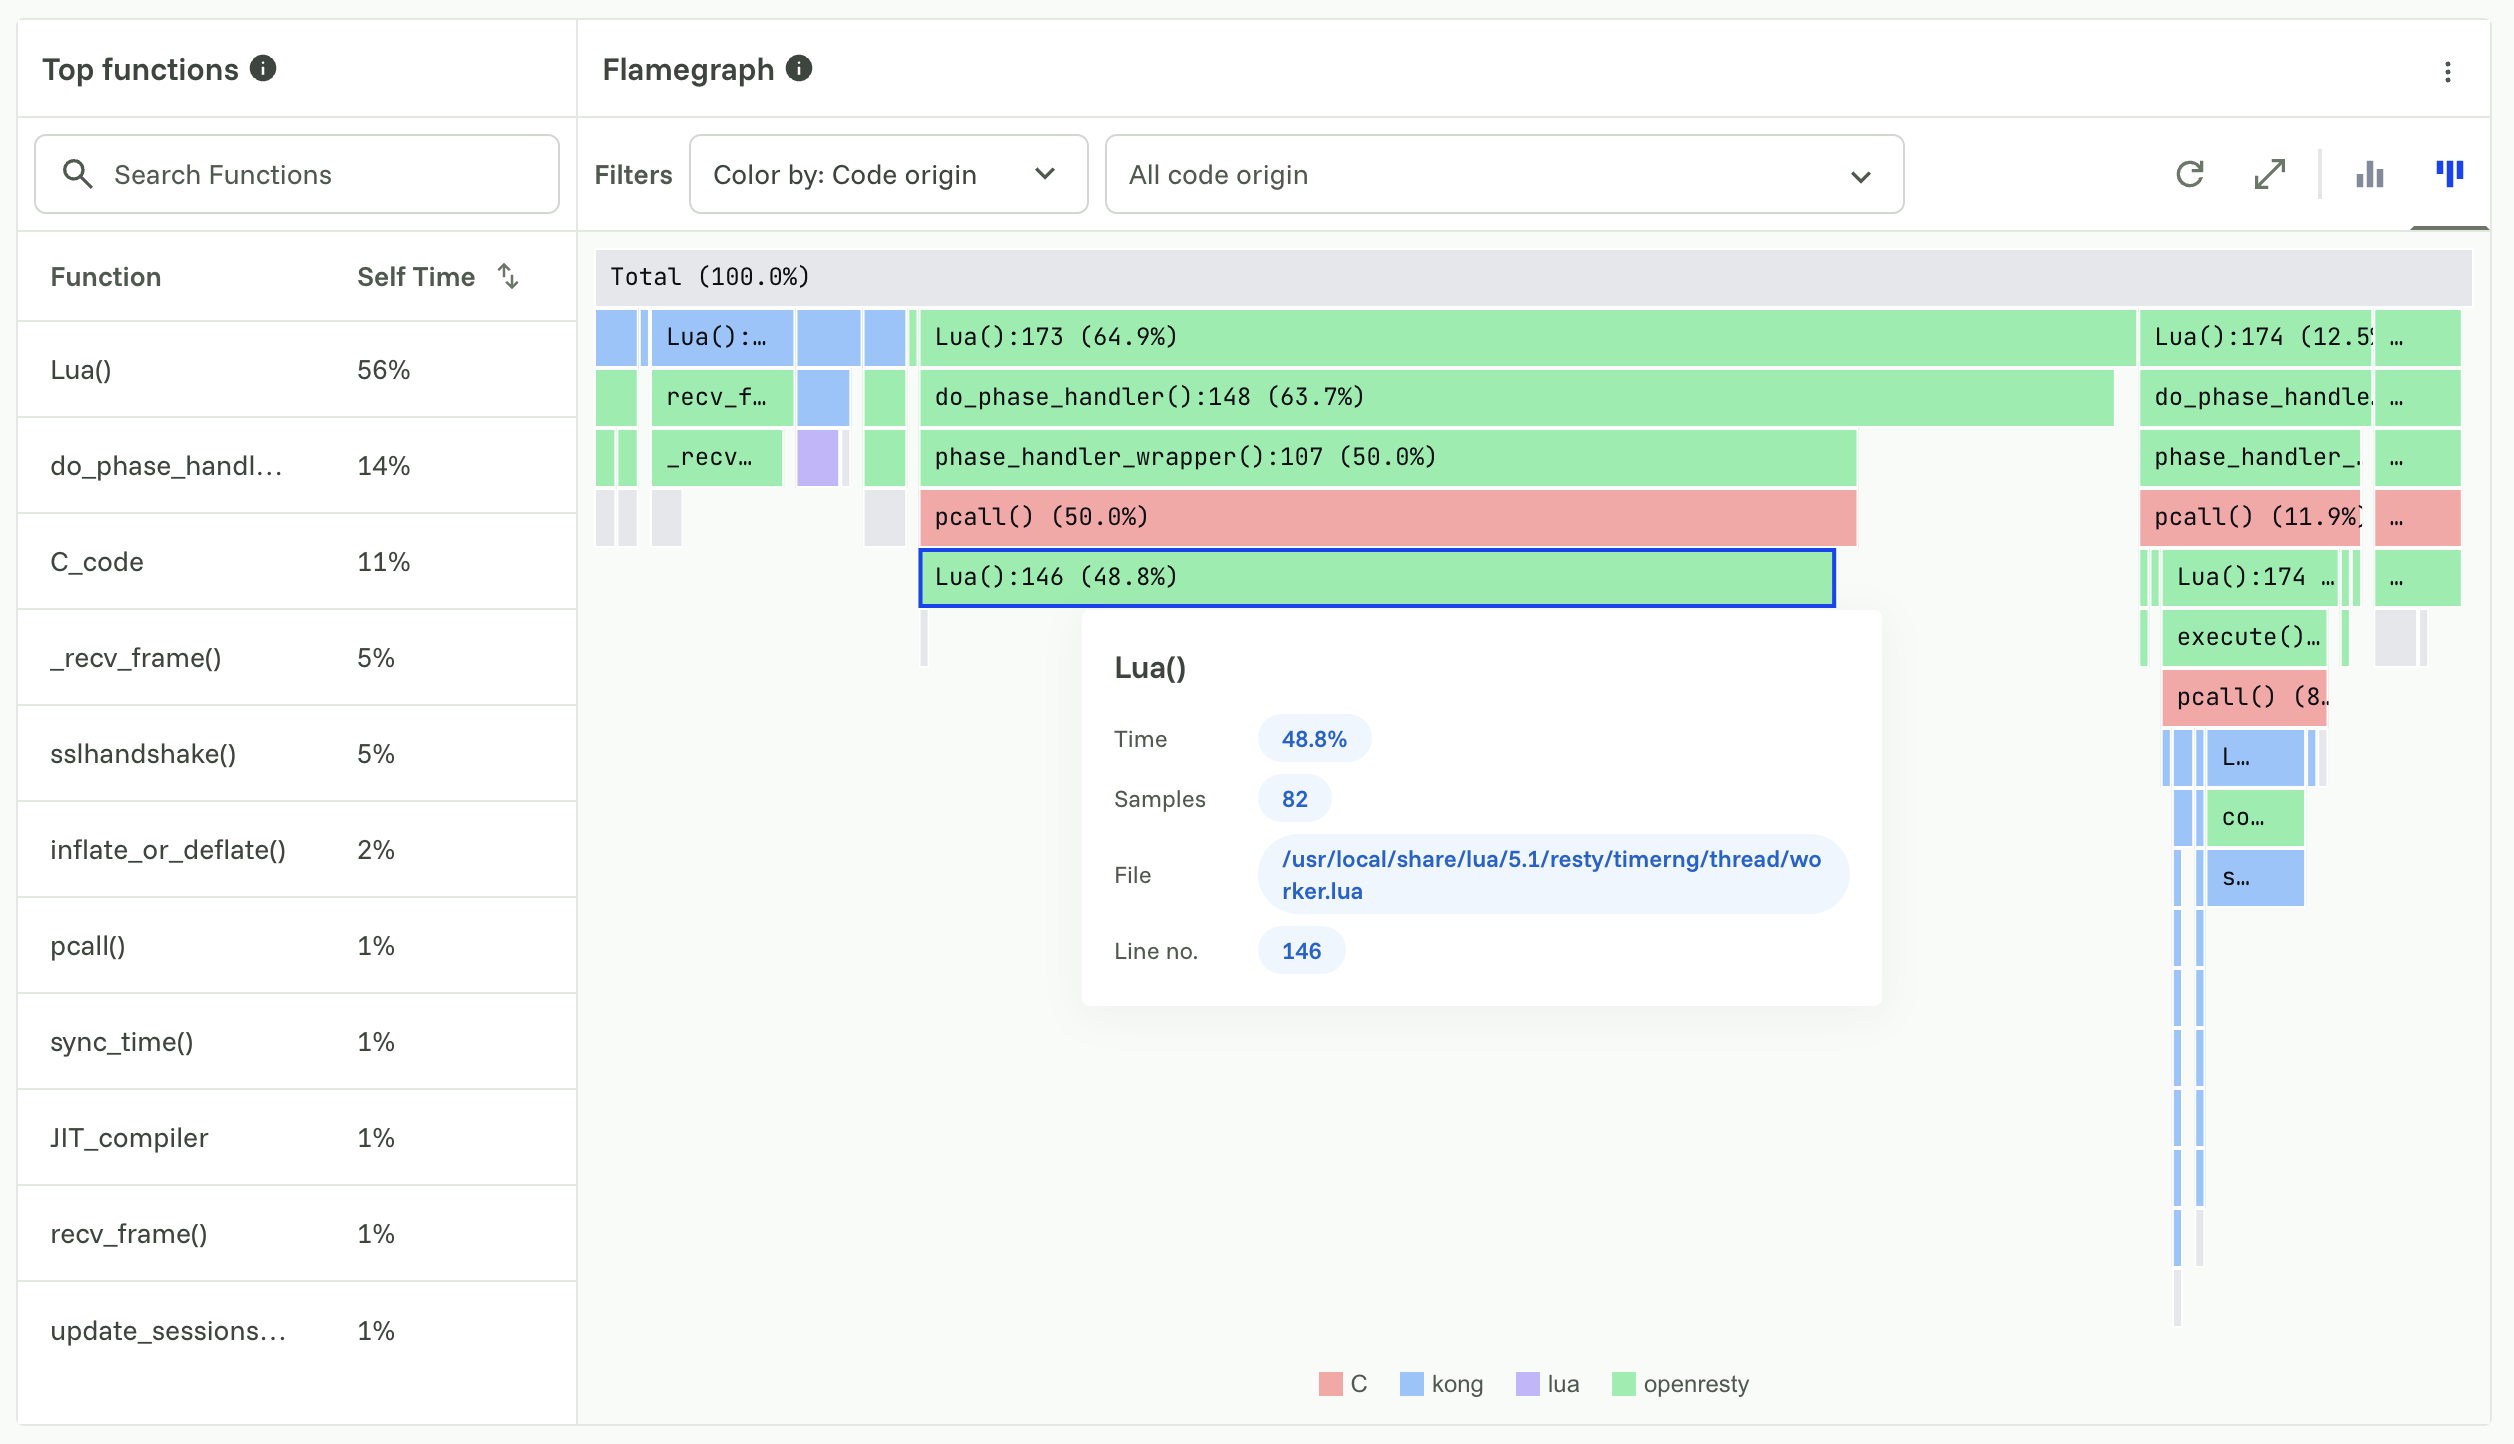
CPU profiling shows which functions consume CPU time during a debug session, down to the Lua, C, and OpenResty function level. Developers can use CPU profiling to check whether a function takes more CPU time than expected, for example by capturing a session before and after releasing a new custom plugin version.

Debugger CPU profiling view with the Top functions table and the flamegraph

CPU profiling is disabled by default. To include a CPU profile in a session, enable the toggle in the CPU Profiling section of the New session form when you start the session.

The session must be completed to generate a CPU profile. If you cancel a session before it completes, the Debugger doesn’t generate any CPU profiling data for it.

The following terms appear in CPU profiles:

Term

Meaning

Self time The percentage of total CPU time a function spent in its own code. Self time excludes time spent in the functions it called.
Phase The OpenResty or Kong processing phase that a frame belongs to, for example timer, log, access, balancer, rewrite, header_filter, or body_filter. Phases break down where CPU time went.
Instruction Based A CPU profiling method that samples the stack after a set number of instructions, which measures CPU cycles.
Time based A CPU profiling method that samples the stack at a set time interval, which measures elapsed time.
Intervals The number of profiling samples captured in the session.

CPU profiling methods

When you enable CPU profiling, select a method and set its sampling interval:

Method

What it measures

Sampling interval

Instruction Based CPU cycles, to find code-level bottlenecks. The number of instructions between each stack sample. A lower value provides higher precision. The default is 500.
Time based Elapsed time, to find execution delays. The time between samples in milliseconds. The default is 500. The maximum duration of the profile is inherited from the Session time field.

Reading the flamegraph

After the session completes, the CPU Profiling tab shows the top functions used in the session and a flamegraph. It can take a couple of minutes for the flamegraph and analysis summary to generate.

  • The top functions table shows every captured function, ranked by self time.

    For example, the top rows of a profile might show phase_handler at 25%, Lua() at 18%, wait() at 10%, and do_phase_handler at 7%.

  • The flamegraph is an icicle-style chart that you can read in the following ways:

    • Vertically: The children of a block are the functions that block calls. The top row is the entry point, and moving down follows the call stack deeper.
    • Horizontally: The width of a block is proportional to that function’s share of total CPU time at that level. A wider block means more CPU time.

Each block has a label with the function name, its source location, and its percentage of total time, for example Lua():173 (47.8%). Scan the flamegraph for a single function or call path that uses a large share of CPU time, then decide whether that’s expected or worth investigating.

Filter by code origin

You can color the flamegraph by plugin or by code origin, then filter further to a specific plugin or code origin. Plugin authors can use this to isolate the frames from their own plugin, instead of picking their code out of the full call tree.

Each function in the flamegraph has one of the following code origins:

Code origin

Color

Description

C Red Native code
kong Blue Kong core code
lua Purple Lua code
openresty Green The OpenResty runtime
plugin Yellow Plugin code

Analyze a profile with KAi

The Flamegraph analysis summary panel uses KAi to generate an explanation of the captured profile. The panel shows when the summary was generated. The summary contains:

  • An action: A short verdict that explains whether the profile points to something to change, with a concrete suggestion. For example, if the profile shows the worker was mostly idle, the suggestion can be to start another debug session while the data plane handles representative traffic.
  • What the profile shows: Bullets that cover which functions and phases dominate CPU time and why. For example, the bullets can report the share of time in each phase (timer, balancer, log, and so on), the self time of specific functions with their sample counts, and how much CPU time plugins use.
  • Suggested follow-ups: Clickable questions under Try that you can ask KAi about the profile. You can also rate the summary with the thumbs up and thumbs down icons, or copy it.

Pin traces and profiles

A pin is a named snapshot of a trace or the session’s CPU profile. It is stored separately from the debug session and remains available for the retention period you choose.

When you pin a trace, any logs, payload captures, and Datakit plugin captures available for that trace are included automatically. A profile pin saves the session’s CPU profile. Pins contain only data available when they are created and don’t update with the original session.

To make data available for a pin, enable the corresponding capture option when you create the session:

  • Enable log capture to include logs.
  • Enable payload capture for headers or body to include payload captures.
  • Enable body capture to include Datakit captures. Header-only capture records Datakit node spans but doesn’t upload Datakit tracing events.
  • Enable CPU profiling to include the session’s CPU profile.

Pinned data uses the retention period selected when you create the pin: 7 days, 30 days, 3 months, or 1 year. Unpinned debug sessions are retained for up to 15 days, and unpinned payload data is retained for up to three days.

Save a trace or profile

  1. In the Konnect sidebar, click Observability.
  2. In the Observability sidebar, click Debugger.
  3. Open the debug session that contains the trace or CPU profile.
    • To save a trace, from the trace row’s actions menu, select Save trace.
    • To save a CPU profile, click the CPU Profiling tab, then from the actions menu, select Save profile.
  4. In the Name field, enter a name for the pin, such as slow-requests-trace. Optionally, in the Description field, enter a description of the pin.
  5. From the Retention period dropdown menu, select a retention period, such as 30 days.
  6. Click Save.

View and manage pins

  1. In the Konnect sidebar, click Observability.
  2. In the Observability sidebar, click Debugger.
  3. Click the Saved traces & profile tab.
  4. Select a saved trace or profile to open it. Saved traces open in the trace viewer with any included logs, payload captures, and Datakit captures. Saved profiles open in the CPU Profiling view.

From the saved list, use the row actions menu to Edit or Delete a pin. You can edit a pin’s name or description, but you can’t add data or change its retention period.

Payload capture

In critical scenarios, having access to payload details can help identify and pinpoint failures. Payload capture lets you configure a debug session to capture headers and/or body for requests and responses.

Payload capture records the following:

  • The client request and response
  • The upstream request and response
  • Headers and body before and after each plugin runs, including custom plugins
  • The contents of calls Kong Gateway makes to third-party dependencies during request processing, such as Redis for rate limiting, an identity provider for token validation, or DNS for resolution
  • Gzip-encoded bodies (Content-Encoding: gzip or x-gzip), automatically decompressed so they appear as readable text

You can use this information to compare the sent request with the received request, and the sent response with the received response, to identify where a failure occurred.

Due to the nature of this telemetry, you must explicitly opt in by signing the Advanced Features Addendum. Contact your organization admin or your Kong representative to get started.

Prerequisites

  • Your organization has opted in to the Debugger payload capture feature and signed the Advanced Features Addendum.
  • Your data plane nodes are deployed with the following telemetry endpoints:

     KONG_CLUSTER_CONTROL_PLANE=xxx.us.cp.konghq.com:443
     KONG_CLUSTER_SERVER_NAME=xxx.us.cp.konghq.com
     KONG_CLUSTER_TELEMETRY_ENDPOINT=xxx.us.tp.konghq.com:443
     KONG_CLUSTER_TELEMETRY_SERVER_NAME=xxx.us.tp.konghq.com
  • Your firewall rules allow traffic to the telemetry endpoints.

Payload collection and sanitization

When you start a debug session with payload capture enabled, the Debugger captures headers and/or body for all requests matching the sampling criteria. Sampling filters and sanitization run on the data plane before any data is transmitted to Konnect.

The log sanitizer scrubs transactions and redacts sensitive data like credit card numbers from the payload. Authentication and identity headers (for example, Authorization, API key header values, and Consumer ID header fields) are also masked by default.

Note: The log sanitizer uses the Luhn algorithm, a well-known algorithm to validate credit card numbers, International Mobile Equipment Identity (IMEI) numbers, and other sensitive numerical data. Matched characters are replaced with *.

Custom masking rules

You can define custom payload masking rules to target specific sensitive data in your requests and responses. Custom rules let you redact data in both headers and body content.

Header rules

Header masking rules let you redact the value of specific headers by name.

Body rules

Body masking rules support two strategies:

  • JSONPath (RFC 9535): Target specific fields in JSON payloads using standard JSONPath expressions. This includes support for dot notation ($.field), bracket notation, wildcards ([*]), recursive descent ($..), array slicing, and filter expressions.
  • Regex (PCRE): Match and redact patterns in the raw body content using PCRE-compatible regular expressions.

Matched content is replaced with *.

Note: Custom masking rules are applied in addition to the built-in credit card redaction. The built-in Luhn algorithm-based redaction is always active and cannot be disabled.

AI Gateway

When a Route has AI plugins configured, payload capture shows the standard payloads in addition to the AI Gateway details view that shows the prompt at each stage of the pipeline:

  • What the client sent
  • What each AI plugin did to the prompt, for example PII sanitization or content filtering
  • The final prompt sent to the model provider, after all plugins have run
  • What the model returned, and how any response plugins transformed it

Use this to confirm guardrails fired, policies were enforced, and transformations produced the prompt you expected. You can also diagnose why a semantic cache hit or missed, or inspect what a guardrail service returned.

Payload ingestion, storage, and retention

By default, Konnect encrypts captured payloads with a default encryption key provisioned for your org. You can also configure Konnect to use customer-managed encryption keys (CMEK). Konnect supports symmetric key encryption and integrates with AWS Key Management Service (KMS).

Debug session payload data is retained for up to 3 days, after which it is purged from Konnect. When you include payload captures in a pin, the pinned copy follows the pin’s retention period.
Data Security with Customer-Managed Encryption Keys (CMEK)

By default, logs are automatically encrypted using encryption keys managed by Konnect. If you have specific security or compliance requirements relating to encryption key management, you can use Customer-Managed Encryption Keys (CMEK). CMEK allows your organization to manage its own encryption key and control Konnect’s ability to decrypt the data protected by that key.

For more information about how to create and manage CMEK keys, see Customer-Managed Encryption Keys (CMEK).

Start your first debug session

To begin using the Debugger, ensure the following requirements are met:

  • Your data plane nodes are running Kong Gateway version 3.9.1 or later.
  • Logs require Kong Gateway version 3.11.0 or later.
  • You need Debug Session Creator, Control Plane Admin, or Org Admin permissions to create debug sessions or pins.
  • Your Konnect data planes are hosted using self-managed hybrid, Dedicated Cloud Gateways, or serverless gateways. Kong Ingress Controller or Kong Event Gateway Gateways aren’t supported.
  • For version 3.9.x only: set the following environment variables in kong.conf:
    • KONG_CLUSTER_RPC=on
    • KONG_ACTIVE_TRACING=on

From version 3.10 and later, these environment variables are enabled by default and no manual configuration is required.

  1. In the Konnect sidebar, click Observability.
  2. In the Observability sidebar, click Debugger.
  3. Click New session.
  4. (Optional) In the Session name field, enter a name for the session, such as slow-requests. If you leave this blank, the session name will be autogenerated.
  5. From the Control plane dropdown menu, select the control plane that contains the data plane nodes you want to debug.
  6. From the Data plane nodes dropdown menu, select one or more data plane nodes.
  7. In the Session time field, enter a duration, and from the unit dropdown menu, select a unit, such as 300 and Seconds.
  8. In the Tracing section, define the sampling criteria. For details, see Sampling rules.
  9. (Optional) In the Capture payloads and logs section, select Payload headers, Payload bodies, or Logs.
  10. (Optional) In the CPU Profiling section, enable the toggle to capture a CPU profile. For details, see Choose a CPU profiling method.
  11. Click Create.

While the session runs, the Debugger captures traces for requests that match the sampling rules. You can click a trace to open it in the span viewer. To keep a trace or CPU profile after the session expires, you can create a pin.

You can also start a debug session from the overview page of a control plane, Gateway Service, or Route by clicking the Actions dropdown menu and clicking Start Debugging. Additionally, you can use KAi to debug as well.

Each session can be configured to run for a time between 10 seconds and 30 minutes. Sessions are retained for up to 15 days.

For details on defining sampling rules, see Sampling rules.

Sampling rules

Sampling rules help you capture only relevant traffic. Requests that match the defined criteria are included in the session. There are two types:

  • Basic sampling rules: Filter by Route or Service.
  • Advanced sampling rules: Use expressions for fine-grained filtering.

For example, to capture all requests with a 503 response:

http.response.status_code==503

The list of all possible sampling expressions are captured here Sampling Rules

In the following sample trace, the spans show that the bulk of the latency occurs in the pre-function plugin during the access phase.

Debugger Spans

Common debugging scenarios

The following scenarios show how to scope a session for a specific problem and what the captured trace data can tell you.

Symptom

Sampling filter

Diagnosis

Intermittent 5xx errors http.response.status_code >= 500 Diagnose whether Kong Gateway routed the request, whether it reached the upstream, whether the upstream returned an error, or whether a plugin terminated the request before it reached the upstream.
Authentication failures http.response.status_code == 401 || !(proxy.kong.upstream.status_code == 401) Look through the traces where the authentication plugin returned the 401 and not the upstream.
Missing or unexpected request transformation Any of:
proxy.kong.route.id == "<route-uuid>"
proxy.kong.service.id == "<service-uuid>"
http.path == "/v1/abc"
Look at the summary view or spans view to diagnose whether plugins executed in the expected order.
Custom plugin failure !(proxy.kong.upstream.status_code >= 100) && http.response.status_code == 500 Diagnose custom plugin errors where the request never reached the upstream because the plugin returned an error. Capture logs along with traces so you can correlate plugin errors with the spans where they occurred.
High API latency proxy.kong.latency_total_ms >= 100 Diagnose which spans took the longest. Use this to rule out custom plugin performance issues, isolate whether the delay was at the upstream or in Kong Gateway, and spot network bottlenecks such as slow DNS lookups or TLS handshakes.

FAQs

Under normal conditions, the Debugger adds negligible latency. However, under heavy load, the Debugger may impact the throughput of data planes being traced.

The entire infrastructure is regionally deployed. All logs, traces, and payload captures are stored within the local geographic region. To see a list of supported geos, see Supported Geos.

Help us make these docs great!

Kong Developer docs are open source. If you find these useful and want to make them better, contribute today!