scrape_configs:
- job_name: 'kong'
scrape_interval: 5s
static_configs:
- targets: ['kong-quickstart-gateway:8001']
Copied!
Enable the AI Proxy Advanced plugin to collect detailed request and model statistics. Then configure the Prometheus plugin to expose these metrics for scraping. Finally, connect Grafana to visualize model performance, usage trends, and traffic distribution in real time.
This is a Konnect tutorial and requires a Konnect personal access token.
Create a new personal access token by opening the Konnect PAT page and selecting Generate Token.
Export your token to an environment variable:
export KONNECT_TOKEN='YOUR_KONNECT_PAT'
Run the quickstart script to automatically provision a Control Plane and Data Plane, and configure your environment:
curl -Ls https://get.konghq.com/quickstart | bash -s -- -k $KONNECT_TOKEN -e KONG_STATUS_LISTEN=0.0.0.0:8100 --deck-output
This sets up a Konnect Control Plane named quickstart, provisions a local Data Plane, and prints out the following environment variable exports:
 export DECK_KONNECT_TOKEN=$KONNECT_TOKEN
 export DECK_KONNECT_CONTROL_PLANE_NAME=quickstart
 export KONNECT_CONTROL_PLANE_URL=https://us.api.konghq.com
 export KONNECT_PROXY_URL='http://localhost:8000'
Copy and paste these into your terminal to configure your session.
This tutorial requires Kong Gateway Enterprise. If you don’t have Kong Gateway set up yet, you can use the quickstart script with an enterprise license to get an instance of Kong Gateway running almost instantly.
Export your license to an environment variable:
export KONG_LICENSE_DATA='LICENSE-CONTENTS-GO-HERE'
Run the quickstart script:
curl -Ls https://get.konghq.com/quickstart | bash -s -- -e KONG_LICENSE_DATA
Once Kong Gateway is ready, you will see the following message:
Kong Gateway Ready
decK is a CLI tool for managing Kong Gateway declaratively with state files. To complete this tutorial, install decK version 1.43 or later.
This guide uses deck gateway apply, which directly applies entity configuration to your Gateway instance.
We recommend upgrading your decK installation to take advantage of this tool.
You can check your current decK version with deck version.
For this tutorial, you’ll need Kong Gateway entities, like Gateway Services and Routes, pre-configured. These entities are essential for Kong Gateway to function but installing them isn’t the focus of this guide. Follow these steps to pre-configure them:
Run the following command:
echo '
_format_version: "3.0"
services:
  - name: example-service
    url: http://httpbin.konghq.com/anything
routes:
  - name: example-route
    paths:
    - "/anything"
    service:
      name: example-service
' | deck gateway apply -
To learn more about entities, you can read our entities documentation.
This tutorial uses OpenAI:
Create a decK variable with the API key:
export DECK_OPENAI_API_KEY='YOUR OPENAI API KEY'
This tutorial uses Mistral:
Export a decK environment variable with the Mistral API key:
export DECK_MISTRAL_API_KEY='YOUR MISTRAL API KEY'
Ensure Grafana is installed locally and accessible. You can quickly start a Grafana instance using Docker:
docker run -d -p 3000:3000 --name=grafana grafana/grafana-enterprise
This command pulls the official Grafana Enterprise image and runs it on port 3000. Once running, Grafana is accessible at http://localhost:3000.
On first login, use the default credentials:
admin
admin
Grafana will prompt you to set a new password after the initial login.
To expose AI traffic metrics to Prometheus, you must first configure the AI Proxy Advanced plugin to enable detailed logging. This makes request payloads, model performance statistics, and cost metrics available for collection.
In this example, traffic is balanced between OpenAI’s gpt-4.1 and Mistral’s mistral-tiny models using a round-robin algorithm. For each model target, logging is enabled to capture request counts, latencies, token usage, and payload data. Additionally, we define input_cost and output_cost values to track estimated usage costs per 1,000 tokens, which are exposed as Prometheus metrics.
Apply the following configuration to enable metrics collection for both models:
echo '
_format_version: "3.0"
plugins:
  - name: ai-proxy-advanced
    config:
      balancer:
        algorithm: round-robin
      targets:
      - model:
          provider: openai
          name: gpt-4.1
          options:
            max_tokens: 512
            temperature: 1.0
            input_cost: 0.75
            output_cost: 0.75
        route_type: llm/v1/chat
        logging:
          log_payloads: true
          log_statistics: true
        auth:
          header_name: Authorization
          header_value: Bearer ${{ env "DECK_OPENAI_API_KEY" }}
        weight: 50
      - model:
          provider: mistral
          name: mistral-tiny
          options:
            mistral_format: openai
            upstream_url: https://api.mistral.ai/v1/chat/completions
            input_cost: 0.25
            output_cost: 0.25
        route_type: llm/v1/chat
        logging:
          log_payloads: true
          log_statistics: true
        auth:
          header_name: Authorization
          header_value: Bearer ${{ env "DECK_MISTRAL_API_KEY" }}
        weight: 50
' | deck gateway apply -
Before you configure Prometheus, enable the Prometheus plugin on Kong Gateway. In this example, we’ve enabled two types of metrics: status code metrics, and AI metrics which expose detailed performance and usage data for AI-related requests.
echo '
_format_version: "3.0"
plugins:
  - name: prometheus
    config:
      status_code_metrics: true
      ai_metrics: true
      bandwidth_metrics: true
      latency_metrics: true
      upstream_health_metrics: true
' | deck gateway apply -
Create a prometheus.yml file:
touch prometheus.yml
Now, add the following to the prometheus.yml file to configure Prometheus to scrape Kong Gateway metrics:
scrape_configs:
 - job_name: 'kong'
   scrape_interval: 5s
   static_configs:
     - targets: ['kong-quickstart-gateway:8001']
scrape_configs:
 - job_name: 'kong'
   scrape_interval: 5s
   static_configs:
     - targets: ['kong-quickstart-gateway:8100']
Now, run a Prometheus server, and pass it the configuration file created in the previous step:
docker run -d --name kong-quickstart-prometheus \
  --network=kong-quickstart-net -p 9090:9090 \
  -v $(PWD)/prometheus.yml:/etc/prometheus/prometheus.yml \
  prom/prometheus:latest
Prometheus will begin to scrape metrics data from AI Gateway.
http://host.docker.internal:9090. Successfully queried the Prometheus API.
21162 in the Find and import dashboards for common applications field.Now, we can generate traffic by running the following CURL request:
for i in {1..5}; do
  echo -n "Request #$i — Model: "
  curl -s -X POST "http://localhost:8000/anything" \
    -H "Content-Type: application/json" \
    --data '{
      "messages": [
        {
          "role": "user",
          "content": "Hello!"
        }
      ]
    }' | jq -r '.model'
  sleep 10
done
Once it’s finished, you’ll see something like the following in the output. Notice that the requests were routed to different models based on the load balancing you configured earlier:
Request #1 — Model: gpt-4.1-2025-04-14
Request #2 — Model: mistral-tiny
Request #3 — Model: mistral-tiny
Request #4 — Model: mistral-tiny
Request #5 — Model: gpt-4.1-2025-04-14
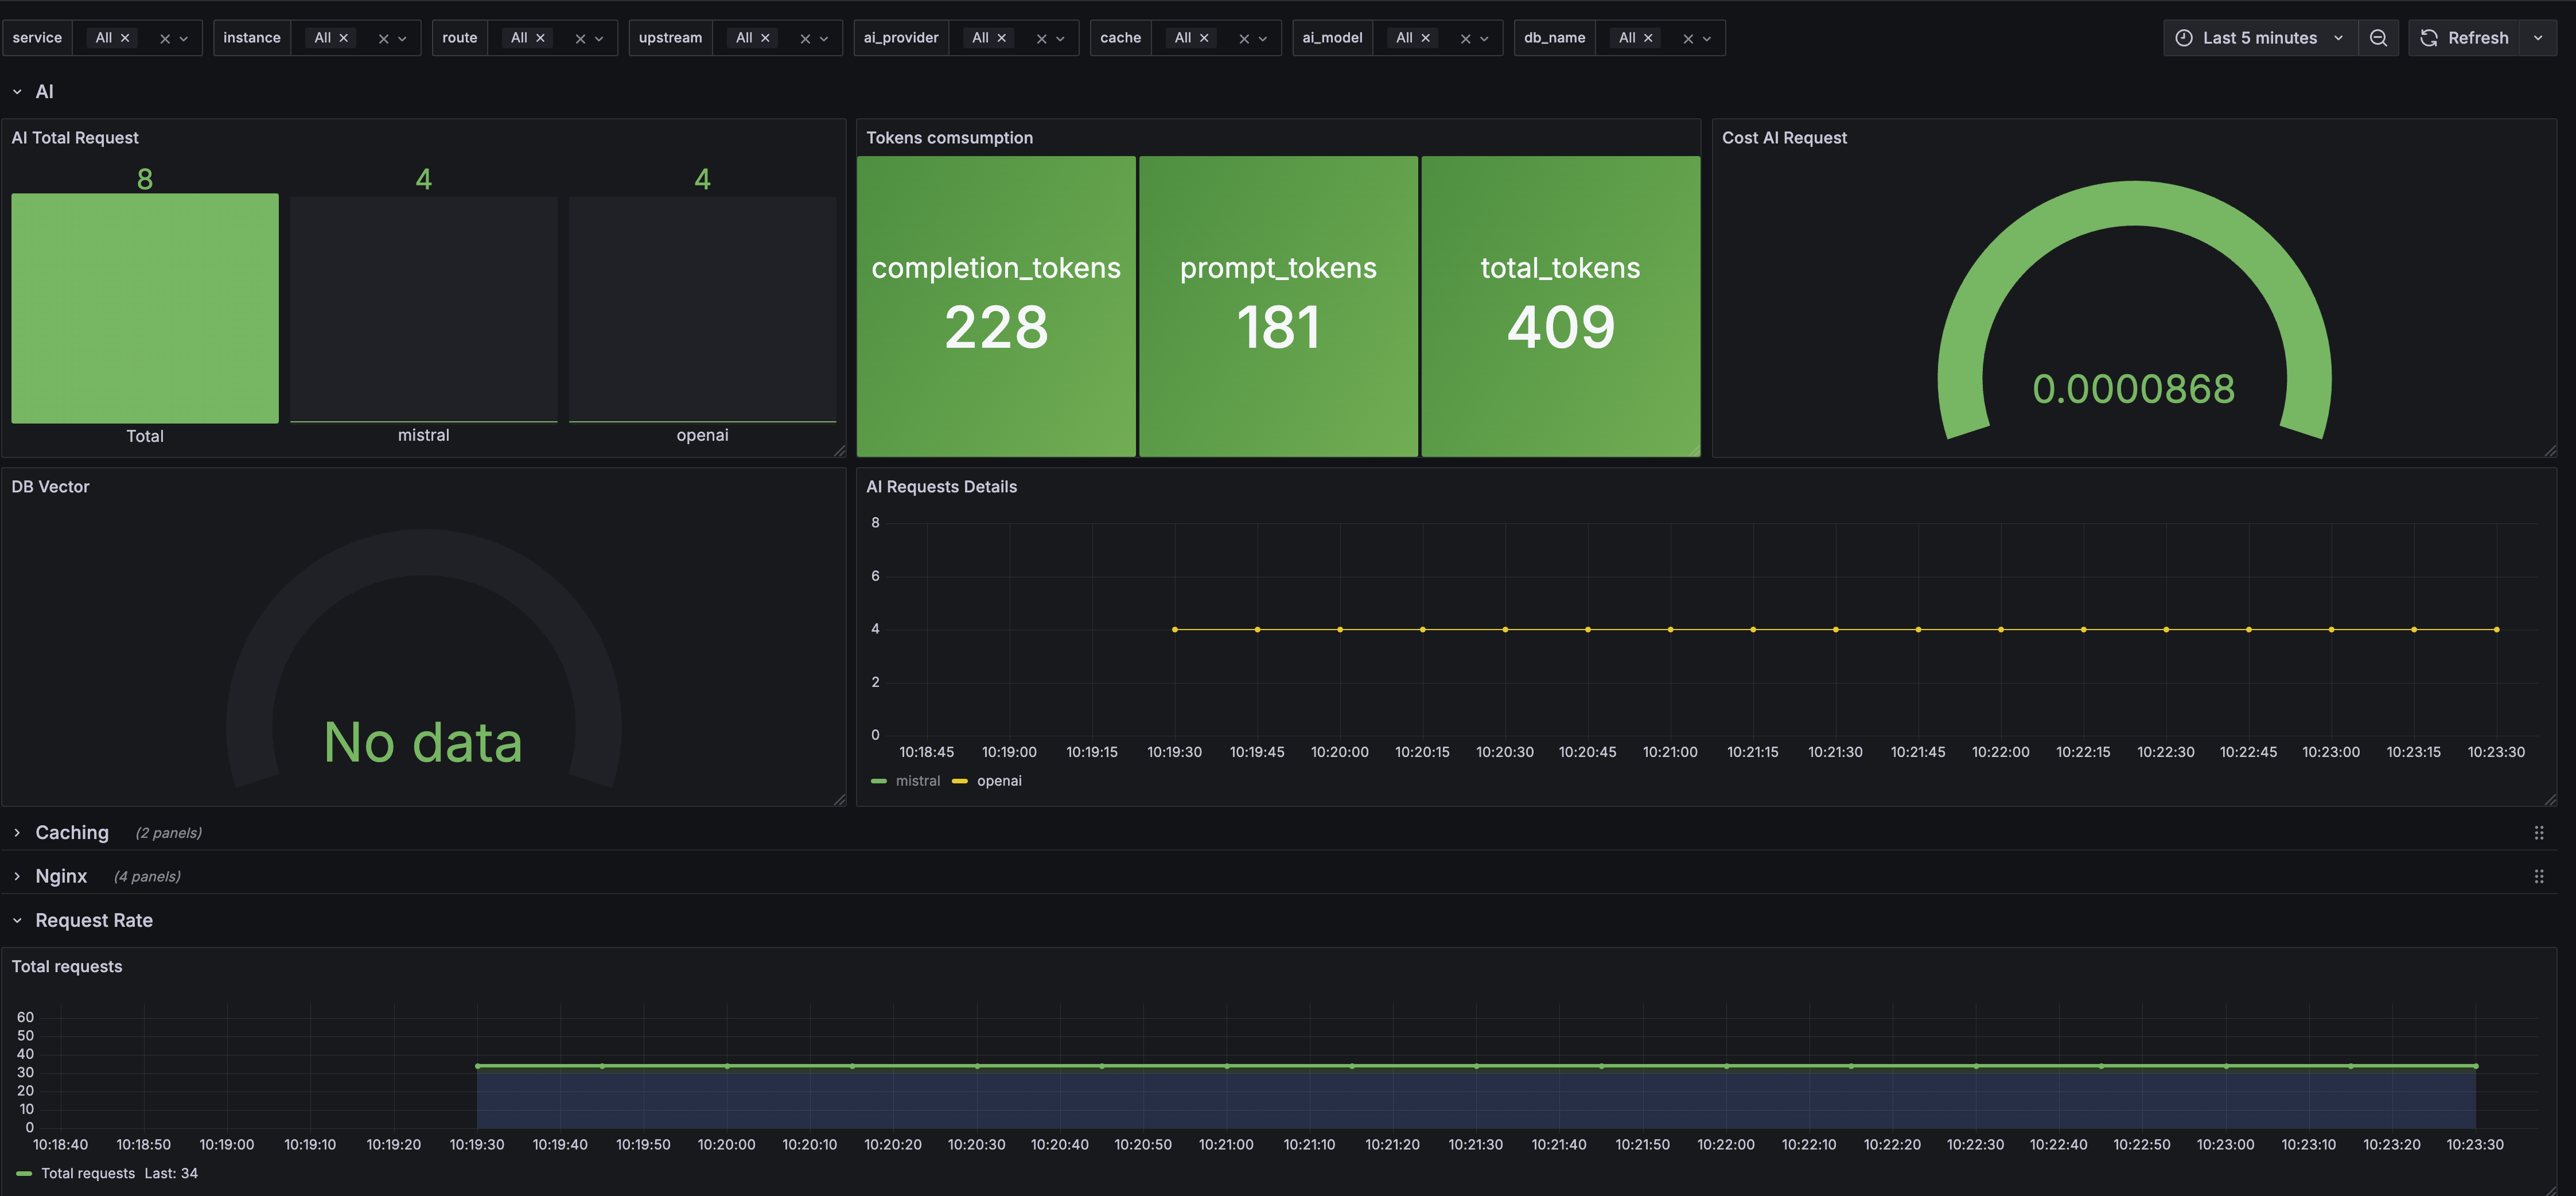
Now you can visualize that traffic in the Grafana dashboard.
completion_tokens, prompt_tokens, and total_tokens.input_costs and output_costs are configured).vector_db is enabled).The visualized metrics in Grafana will look similar to this example dashboard:
If you created a new control plane and want to conserve your free trial credits or avoid unnecessary charges, delete the new control plane used in this tutorial.
curl -Ls https://get.konghq.com/quickstart | bash -s -- -d