Traces captured during a debug session can be visualized in debugger’s built-in trace viewer. The trace viewer displays Summary, Spans and Logs view. You can gain instant insights with the summary view while the spans and logs view help you to dive deeper.
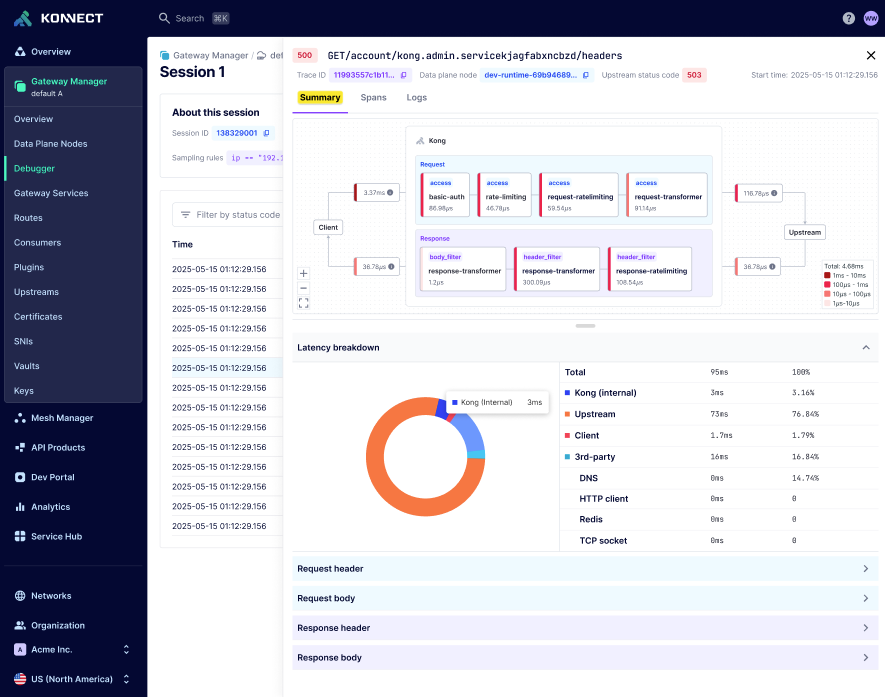
Summary view helps you visualize the entire API request-response flow in a single glance. This view provides a concise overview of critical latency metrics and a transaction map. The lifecycle map includes the different phases of Kong Gateway and the plugins executed by Kong Gateway on both the request and the response along with the times spent in each phase.
Use the summary view to quickly understand the end-to-end API flow, identify performance bottlenecks, and optimize your API strategy:
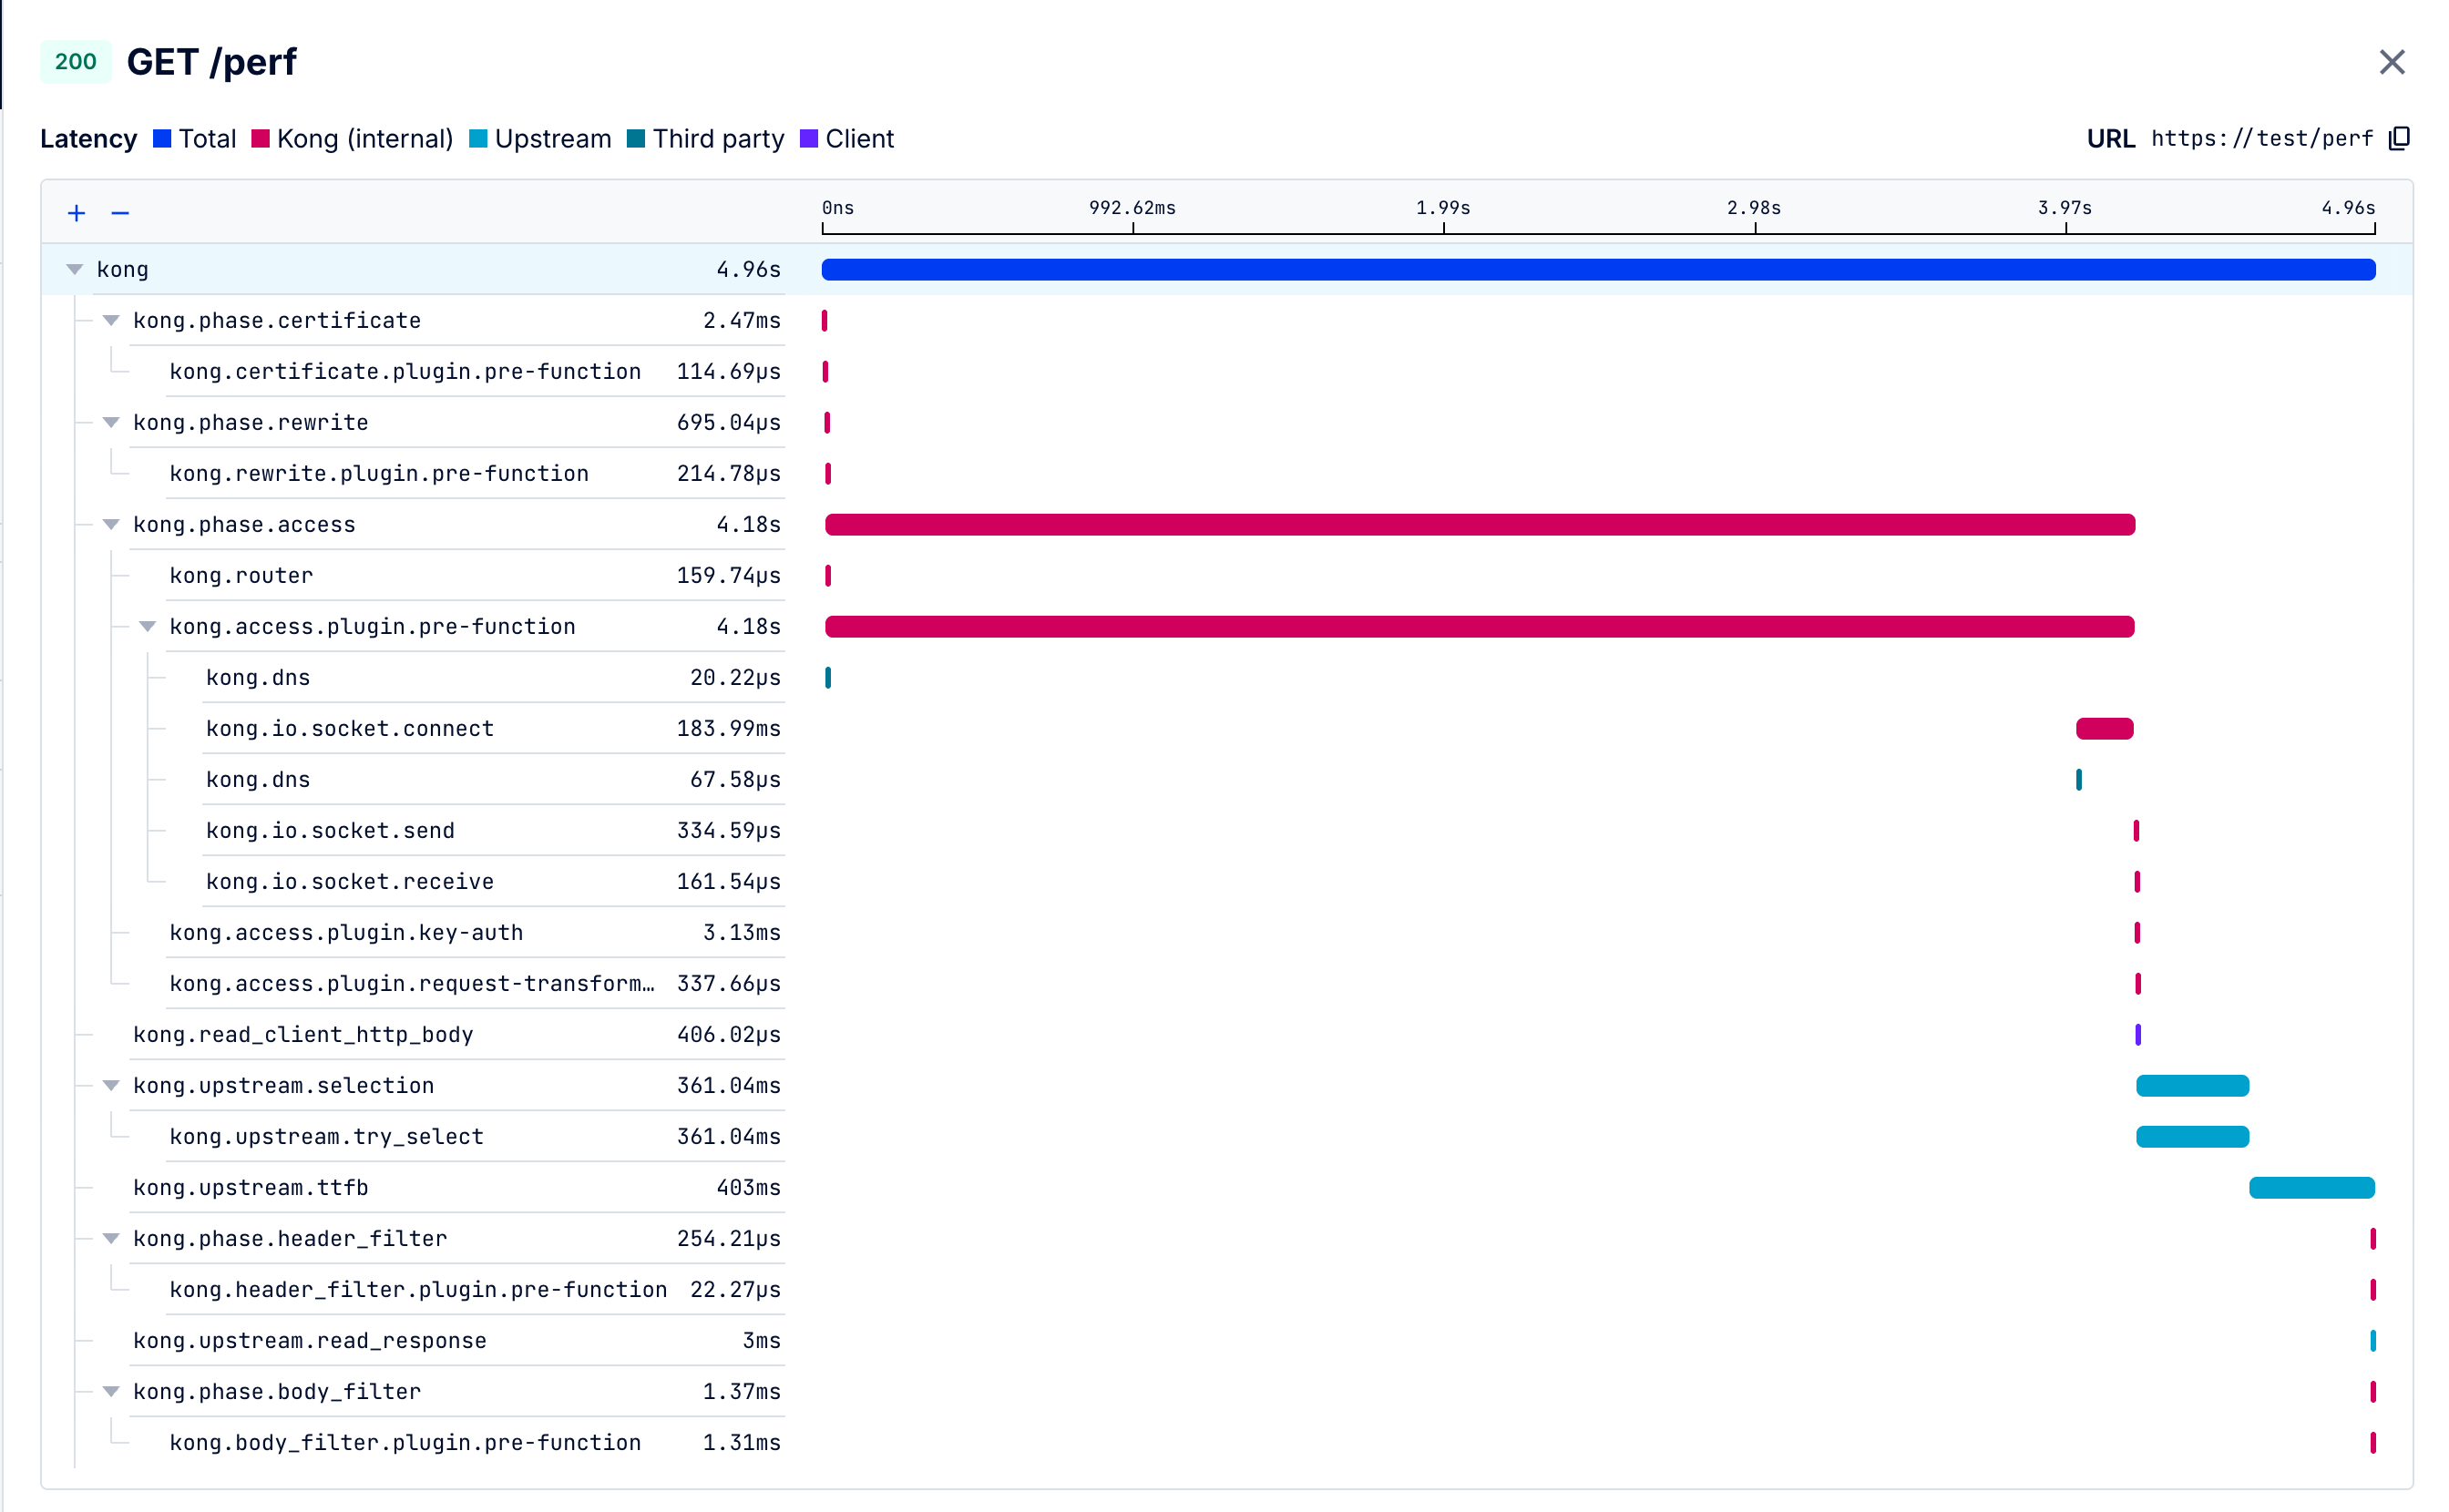
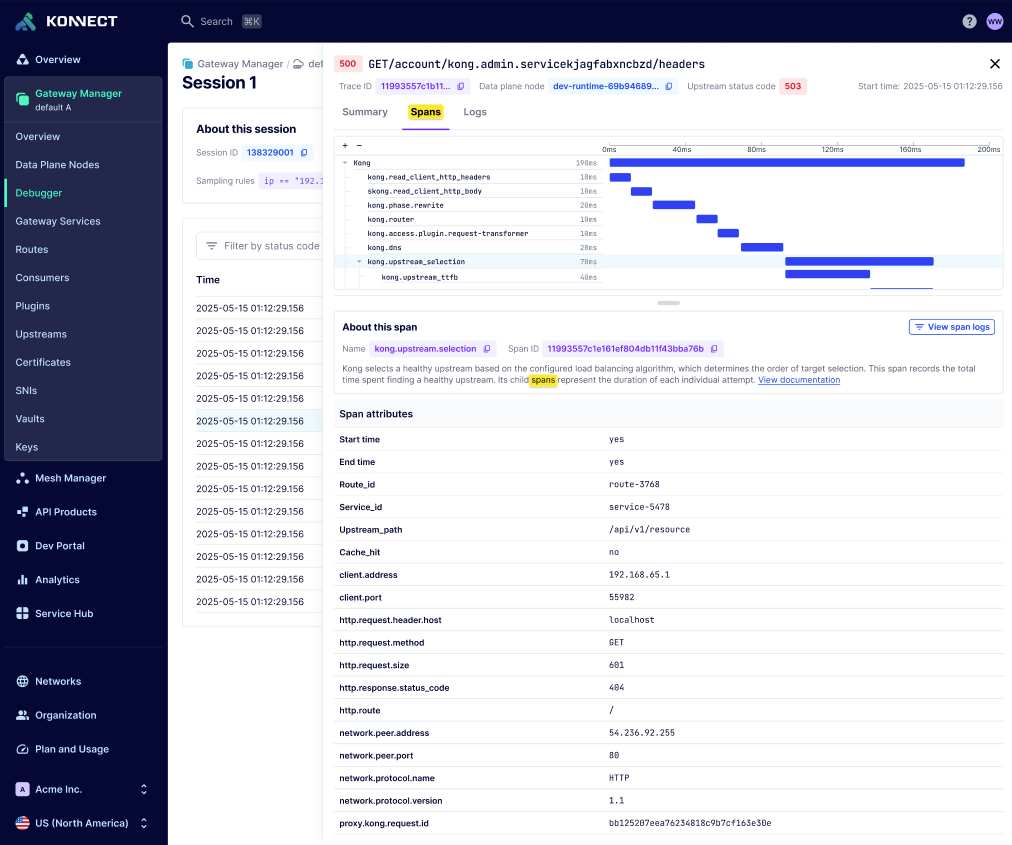
The spans view gives you unparalleled visibility into Kong Gateway’s internal workings. This detailed view breaks down into individual spans, providing a comprehensive understanding of:
- Kong Gateway’s internal processes and phases
- Plugin execution and performance
- Request and response handling
For detailed definitions of each span, see Debugger spans.
Use the spans view to troubleshoot issues, optimize performance, and refine your configuration:
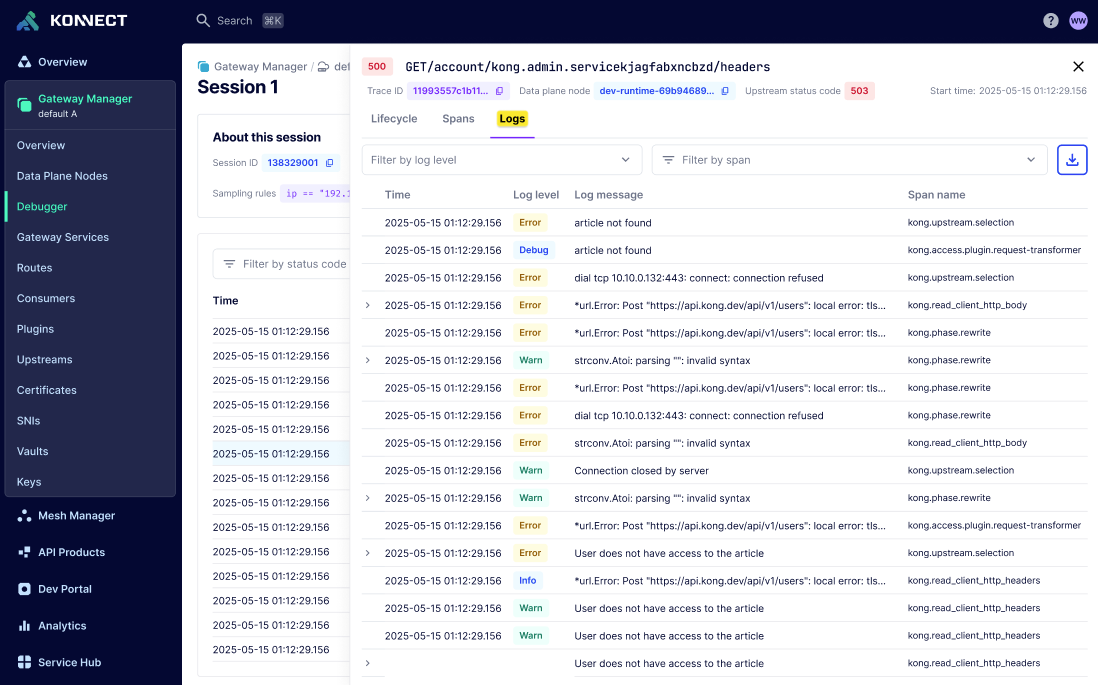
The logs view gives you a drill-down view of all the logs generated during specific debug session. All the spans in the trace are correlated using trace_id and span_id. The logs can be filtered on log level and spans. Logs are displayed in reverse chronological order. Konnect encrypts all the logs that are ingested. You can further ensure complete privacy and control by using customer-managed encryption keys (CMEK).
Use the logs view to quickly troubleshoot and pinpoint issues: